3.1 Marginal Analysis
Introduction
This is an exam which looks at seven different economic situations, and you discuss how they affect consumers, producers, the government, and allocative efficiency.
There are 7 graphs that you need to know:
The Market Graph
Taxes
Subsidies
Maximum price
Minimum price
Quotas
Tariffs
For each graph you need to know how to draw:
Producer surplus
Consumer surplus
Deadweight loss
Government revenue/cost
You need to be able to explain the impact on:
Producers
Consumers
The government
Allocative efficiency
The Market Graph
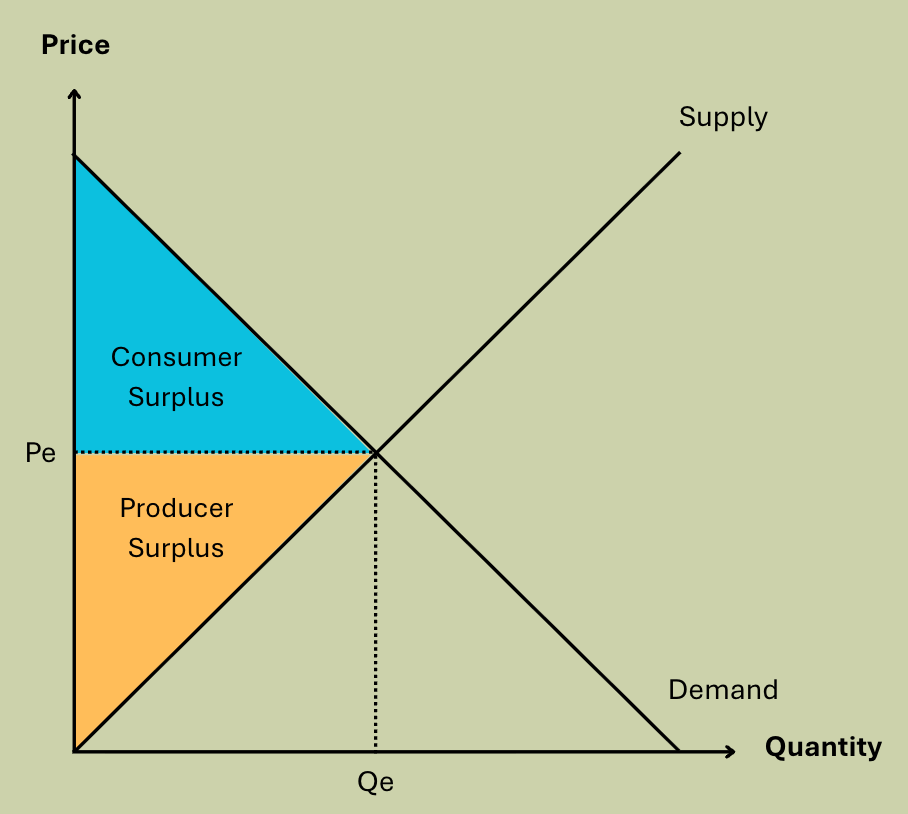
The market shows demand and supply for a particular good or service. In the exam, you need be able to how to restore equilibrium when there is a shortage or surplus.
How is equilibrium restored when there is a shortage?
There is a shortage at the original market equilibrium price (Pe) (because Qs < Qd). Therefore consumers bid up price in order to secure stock. This causes the quantity supplied to increase because it is more profitable and quantity demanded to decrease because the higher price less attractive. This continues until the market reaches the new market equilibrium at Pe and Qe, where QS=QD.
How is equilibrium restored when there is a surplus?
There is a surplus at the original market equilibrium price (Pe) (because Qs > Qd). Therefore producers reduce price in order to sell off surplus stock. This causes the quantity supplied to decrease because it is less profitable and quantity demanded to increase because the cheaper price is attractive. This continues until the market reaches the new market equilibrium at Pe and Qe, where QS=QD.
Watch the video 👇
The Tax Graph
Excise taxes are special indirect taxes placed on specific goods/services, often used to discourage consumption.
‘Inelastic demand’ means that a change in price will result in a proportionately smaller change in quantity demanded. The curve is steeper.
‘Elastic demand’ means that a change in price will result in a proportionately larger change in quantity demanded. The curve is flatter.
Impact of a tax on consumers
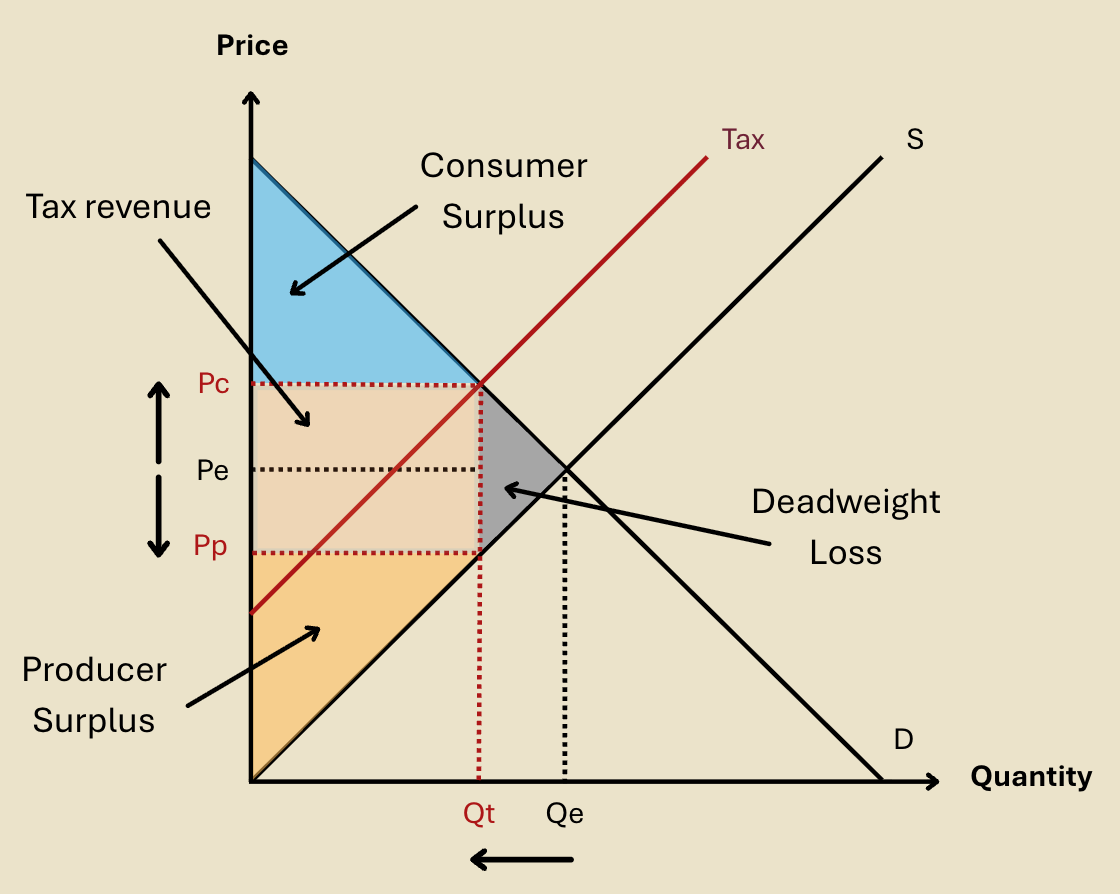
Consumers are worse off because they need to pay a higher price (price increases from Pe to Pc), hence they decrease the quantity they consume (quantity decreases from Qe to Qc). The difference between what consumers are willing to pay and actually pay decreases, and there are less units from which to gain a surplus. Hence consumer surplus decreases.
Impact of a tax on producers
Producers are worse off because they receive a lower price (price decreases from Pe to Pp), and they sell less (quantity decreases from Qe to Qt). The difference between what producers are willing to recieve and actually recieve decreases, and there are less units from which to gain a surplus. Hence producer surplus decreases.
Impact on allocative efficiency
Before the tax, the market is allocatively efficient because the consumer and producer surpluses are maximised and there is no deadweight loss. When the tax is added, consumer surplus decreases, and producer surplus decreases. These decreases are not outweighed by the government’s tax revenue, as indicated by the deadweight loss. Hence when there is a tax, the market is not allocatively efficient. Total surpluses are not maximised and there is a net welfare loss.
Watch the video 👇
Impact on the government
The government is better off because they receive the tax revenue (shaded on graph). This can be used to fund projects, for example education, infrastructure and health.